Stock Yards Bancorp Offers Seven Consecutive Years of Dividend Hikes (SYBT)
By: Ned Piplovic,

Stock Yards Bancorp, Inc. (NASDAQ:SYBT) has rewarded its shareholders with seven consecutive years of dividend hikes and failed to boost its annual dividend amount just once since starting dividend distributions in 1990.
The company has increased its dividend distributions significantly over the past five years. However, the share price rose at an even faster pace and suppressed the dividend yield to 2.3%, which is more than 25% below the company’s own 3.1% five-year average yield. While the share price rose over the long term, it has experienced moderate volatility since early June 2017, which was reflected in two substantial declines over the past 12 months. However, the share price has been trending higher since mid-March 2018.
Investors convinced that the share price uptrend over the past 60 days might continue should do their research and take a position prior to the company’s next ex-dividend date on June 15, 2018, and ensure their eligibility for the next round of dividend distributions on the July 2, 2018, pay date.

Stock Yards Bancorp, Inc. (NASDAQ:SYBT)
Headquartered in Louisville, Kentucky, and incorporated in 1988, Stock Yards Bancorp, Inc. operates as a holding company for the Stock Yards Bank & Trust Company, which was established in 1904. In addition to its standard banking operations, the Stock Yards Bank & Trust Company offers a broad array of other financial services, including those of its Wealth Management Group, which provides investment management and trust services. The bank’s mortgage company also offers conventional, Veterans Affairs (VA) and Federal Housing Administration (FHA) financing, as well as a program for low-income first-time homebuyers. As March 2018, the bank offered its services through 37 locations — 28 in the Louisville metropolitan statistical area (MSA), 4 in the Indianapolis MSA and 5 locations in the Cincinnati MSA.
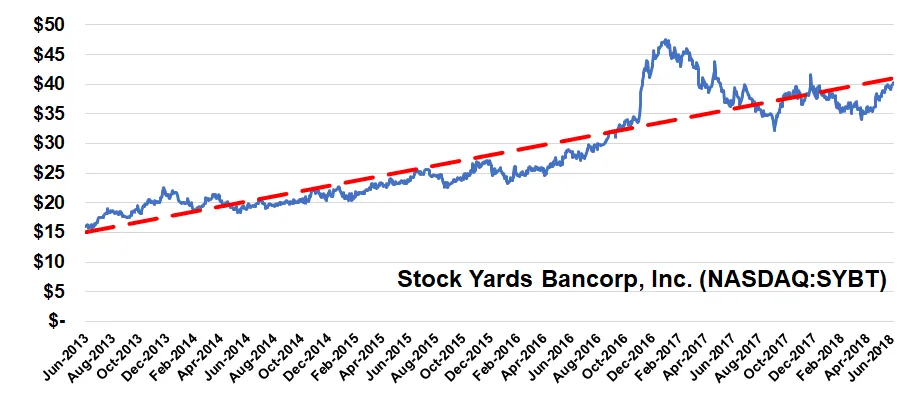
The company’s share price started the trailing 12-month period with a 12.5% decline towards its 52-week low of $32.25, which it reached on September 7, 2017. After bottoming out at the beginning of September 2017, the share price reversed direction and rose rapidly to reach its 52-week high of $41.60 by the end of November 2017. However, the share price did not hold that peak level for long.
After another direction reversal, the share price declined almost 20% to $34 by March 23, 2018. Since March 23, 2018, the share price regained almost all its losses and closed on June 5, 2018, at $40.15, which was just 3.5% below the 52-week high from the end of November 2017 and the third highest closing price over the previous 12 months. Additionally, the June 5, 2018, closing price was 9% higher than it was one year earlier, 24.5% above the 52-week low from September 2017 and 154% higher than it was five years ago. While the share price experienced a brief decline from a recent spike, the current share price is right on the company’s long-term trendline, as indicated in the chart below.

Data Source: Yahoo Finance
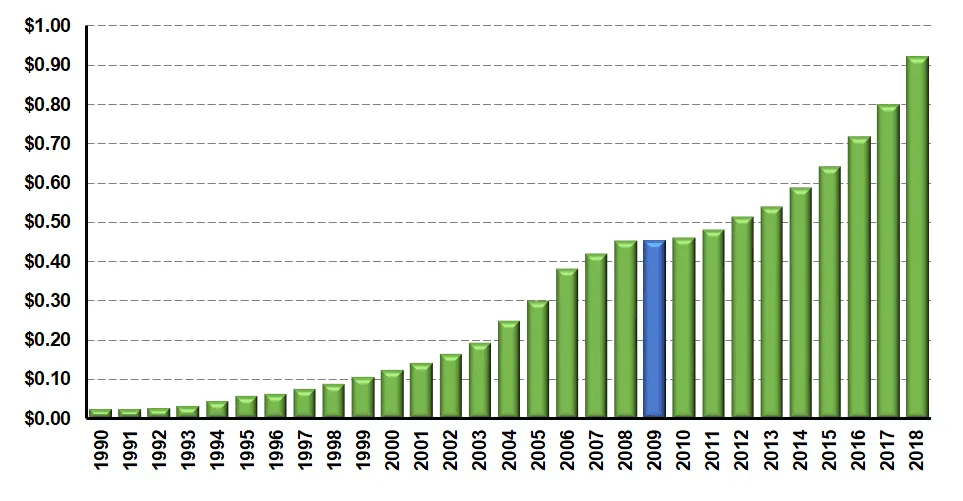
The current quarterly dividend rose 15% from $0.20 to $0.23, which equals a $0.80 annual payout and a 2.2% yield. The company’s dividend hike history is much better than what the current streak of seven consecutive annual dividend hikes indicates. Over the past 20 years, Stock Yards Bancorp failed to raise its annual dividend amount only once when it paid the same dividend in 2009 and 2010, following the financial crisis. Since 1998, the company raised its annual distribution by an average rate of 12.5% every year for the past 20 years.

Data Source: Yahoo Finance
The company’s quarterly dividend 15% from $0.20 in the same quarter of last year to the current $0.23 distribution. This current quarterly dividend payout corresponds to a $0.92 annualized dividend for 2018 and a 2.3% forward yield. While this current dividend yield is slightly below the average yield of the entire Financials sector, it is 43% above the 1.6% simple average yield of the Southeast Regional Banks industry segment. Additionally, the banks 2.3% dividend yield is also 4.2% higher than the 2.2% average yield of just dividend-paying companies in the segment.
Over the past eight years of consecutive annual dividend hikes, the company doubled its annual dividend payout, which corresponds to an average growth rate of 9.3% per year. While the company failed to hike its annual dividend in 2008, that was the only missed dividend hike since the company started paying dividends in 1990. Since the dividend’s inception in 1990, the company advance its dividend payouts at an average rate of 12.3% per year.
Over the past year, the company offered its investors a total return of more than 10%. Additionally, the company’s total return over the past three years was 81%, and returns were more than 167% over the past five years.
Dividend increases and dividend decreases, new dividend announcements, dividend suspensions and other dividend changes occur daily. To make sure you don’t miss any important announcements, sign up for our E-mail Alerts. Let us do the hard work of gathering the data and sending the relevant information directly to your inbox.
In addition to E-mail Alerts, you will have access to our powerful dividend research tools. Take a quick video tour of the tools suite.


