The S&P 500 Dividend Yield: A Historical Analysis
By: Ned Piplovic,

While some current components of the S&P 500 Index do not pay any dividends, the majority of companies in the index deliver steady dividend distribution with an average dividend yield of approximately 2%.
The 419 companies, or nearly 85%, in the index that offer dividends combine for an annualized payout of nearly $60 per share. Since December 2015, the dividend yield fluctuated between 1.73% and 2.25% for a simple, unweighted average of 1.96% over the past four years. However, before getting into additional details and the history of the S&P 500 dividend yield, let us take a closer look at the origins and makeup of the S&P Index.
The S&P 500 Index
The index comprises stocks of 500 large-cap companies. However, the index actually contains 505 individual stocks. The reason for the additional components is that five of the included companies have two separate classes of their shares included in the index: Alphabet Inc., (NASDAQ:GOOGL and NASDAQ:GOOG), Discovery, Inc. (NASDAQ:DISCA and NASDAQ:DISCK), Fox Corporation (NASDAQ:FOXA and NASDAQ:FOX), News Corporation (NASDAQ:NWSA and NASDAQ:NWS) and Under Armour, Inc. (NYSE:UA and NYSE:UAA).
One additional company, Berkshire Hathaway, Inc., also has two classes of stock (NYSE:BRK.A and NYSE:BRK.B). However, the index includes only the Class B stock. Berkshire Hathaway’s Class A stock’s high share price, $360,380 per share at the end of trading on December 16, 2019, limits the stock’s trading volume to just few hundred shares per trading session. This low trading volume is not significant enough and the high share price are not representative of the overall market and economic trends
Eligibility
Equities must meet multiple eligibility requirements for inclusion in the S&P 500. All equities must offer common shares of stock available to the public and must be corporations domiciled in the United States. Additionally, the companies must have market capitalization in excess of $8.2 billion, as well as a minimum monthly trading volume of 250,000 shares for the six-month preceding the index’s quarterly rebalancing date. The index rebalances its components every quarter in March, June, September and December. Furthermore, each corporation’s dollar-value traded annually must exceed the float-adjusted market capitalization.
Dividends
Currently, 419 of the 500 equities included in the S&P 500 index offer dividend distributions to its shareholders. As equities with large market capitalizations, many S&P 500 components are well-established companies with stable business models and strong financial fundamentals. As such, these companies offer reliable dividend income payouts that have risen over time. The graph below shows growth of the total annual dividend payout per unit of the S&P 500 Index since 1870. While the annual payouts fluctuated with bear and bull markets, the S&P dividend distributions maintained an overall uptrend, which accelerated significantly after 2010.

While dividend payouts continue to rise, the share prices of the underlying index components have advanced at a faster pace over the past couple of decades. Therefore, the current S&P 500 dividend yield of 1.82% is slightly lower than the 2.04% figure from December 2015, as well as marginally below the 1.96% simple dividend yield average over the last four years. The graph below shows the dividend yield fluctuation for the trailing four-year period.

S&P Dividend Aristocrats
The S&P 500 Index contains a special group of equities, dubbed the S&P Dividend Aristocrats, that have extended records of robust dividend growth. Dividend Aristocrats are S&P 500 components that have boosted their annual dividend payouts for at least the past 25 consecutive years and meet few additional requirements.
The original market capitalization requirement for receiving the Dividend Aristocrats moniker was $3 billion. However, since the current minimum for inclusion in the S&P 500 Index is $8.2 billion, all S&P 500 components already meet that minimum requirement.
In addition to the minimum market capitalization and at least 25 consecutive annual dividend hikes, companies must have a $5 million minimum average daily trading value during the three-month period before the rebalancing date. Furthermore, the Dividend Aristocrats group must contain at least 40 components. Also, using the Global Industry Classification Standard (GICS) to calculate the total market capitalization by sector, no sector can comprise more than 30% of the combined market capitalization of all Dividend Aristocrats.
S&P Dividend Aristocrats Origins
The S&P 500 can trace its origins to an index of 233 stocks compiled in 1923 by the Standard Statistics Company. However, the current format of the S&P index did not take its present shape until 1957. The first S&P 500 Dividend Aristocrats list did not see light until 1989. At that time, there were only 26 Dividend Aristocrats.
The Dividend Aristocrats list rebalances quarterly like the S&P 500 Index. However, the Dividend Aristocrats list rebalances in January, April, July and October, which is one month after the S&P 500 Index rebalancing takes place. With quarterly rebalancing, the number and composition of the Dividend Aristocrats group began changing the year after its introduction.
The number of components reached a high of 64 companies in 2001. However, several companies broke their consecutive boost streaks by cutting or outright eliminating dividend distribution payouts in the aftermath of the 2008 financial crisis, which reduced the number of Dividend Aristocrats to just 43 in 2009. However, over the past decade, new companies met the necessary eligibility requirement and joined the group to expand the number of Dividend Aristocrats back up to the current 57 member companies.
S&P 500 Dividend Yield Significance
Investment professionals and financial experts disagree on the level of benefit that dividend distributions contribute to the overall performance of an equity. One side of the argument claims that earnings should be invested in opportunities with the highest returns and that distributing earnings to shareholders as dividends is warranted only if there are no investment opportunities for higher returns. However, historically back tested data support the claim that dividend-paying companies deliver higher total returns, as well as reduced volatility.
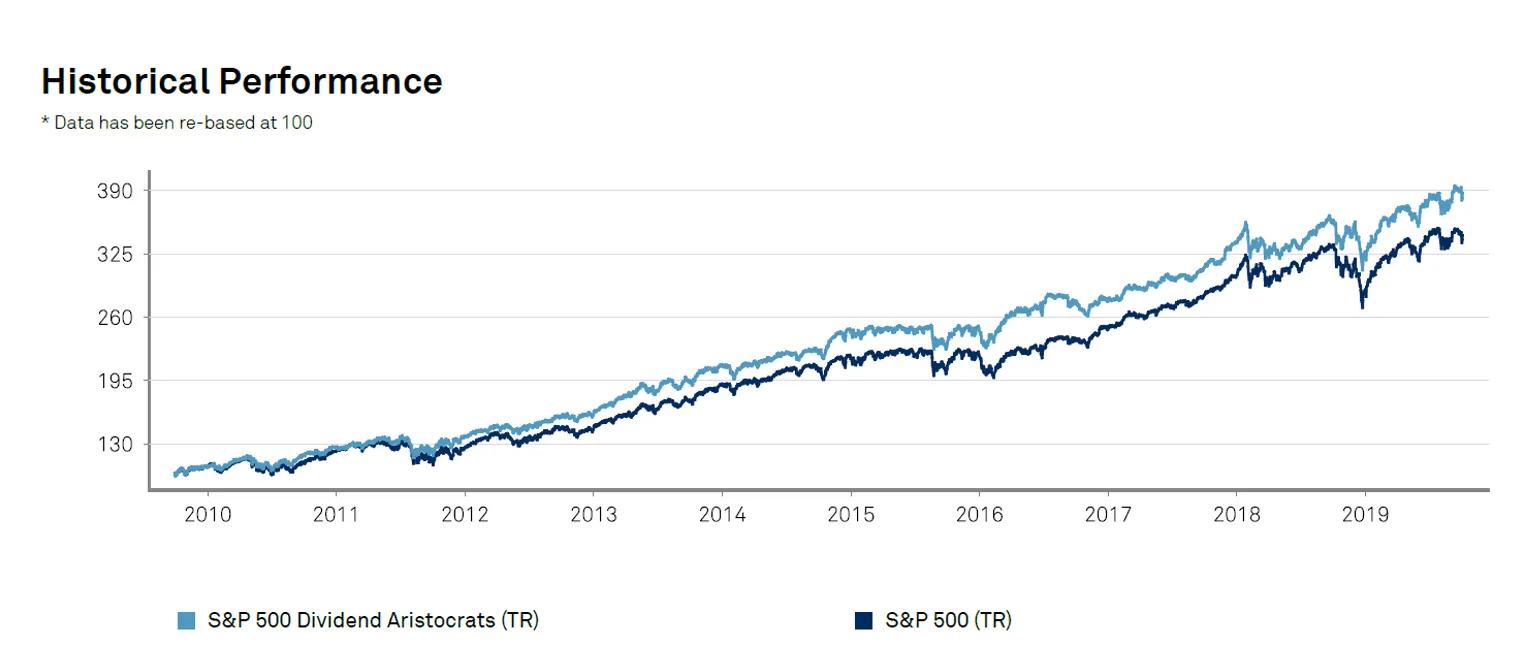
Even a direct comparison of just the Dividend Aristocrats against the overall S&P 500 shows that the 57 companies with long-term dividend distributions outperformed the overall index by a noticeable margin. Just over the past 10 years, the Dividend Aristocrats delivered cumulative total returns that were 11% higher than the total returns of the entire S&P 500 Index over the same period, shown on the graph below.

Chart Source: S&P Dow Jones Indices
Recent and Historical Dividend Yield
Historically, the S&P 500 maintained an above-average yield for most of its existence. The index’s dividend yield never fell below 3% before 1960. In fact, during half the years between 1871 and 1960, the S&P’s dividend yield exceeded 5%. Even between 1960 and 1990, the dividend yield fell below 3% approximately 17% of the time.
However, significant changes in the makeup of the overall market pushed dividend yields lower. The internet and personal computing boom that began in the mid-1990s resulted in inclusion of more technology companies in the S&P 500 Index. Because technology companies funnel most of their earnings back into expansion, research and development, very few technology companies pay dividend distributions, and when they do, the payouts and the dividend yield are very low.
Additionally, very low Federal Reserve interest rates and the expansion of the money supply flooded the equities market with cash that investors funneled into securities. The increased demand for securities drove share price higher at a much faster pace than dividend growth during that period, which suppressed the average yield from a 4%-plus average between 1970 and 1990 to below 2% since 1991.
Therefore, despite steady growth, the S&P 500 dividend yield remains at approximately 2%, which appears to be new normal level. However, despite the reduced dividend yield over the past couple of decades, the overall S&P 500 index still provides a great selection of equities with stable dividend distributions and robust asset appreciation that combine into steady total returns over for foreseeable future.
Dividend increases and dividend decreases, new dividend announcements, dividend suspensions and other dividend changes occur daily. To make sure you don’t miss any important announcements, sign up for our E-mail Alerts. Let us do the hard work of gathering the data and sending the relevant information directly to your inbox.
In addition to E-mail Alerts, you will have access to our powerful dividend research tools. Take a quick video tour of the tools suite.


